Analysis and Visualization Tools
A Policy Analysis Toolbox for Taxis
This toolbox offers a comprehensive sensitivity analysis of the taxi market. It can simulate various scenarios to demonstrate how changes in fleet size and pricing affect platform revenues, drivers' monthly income, order matching rates, and driver utilization rates. The analyze results can assists government or operators in optimizing fleet management and pricing strategies for better market regulation.
GO TO TOOLBOX ➤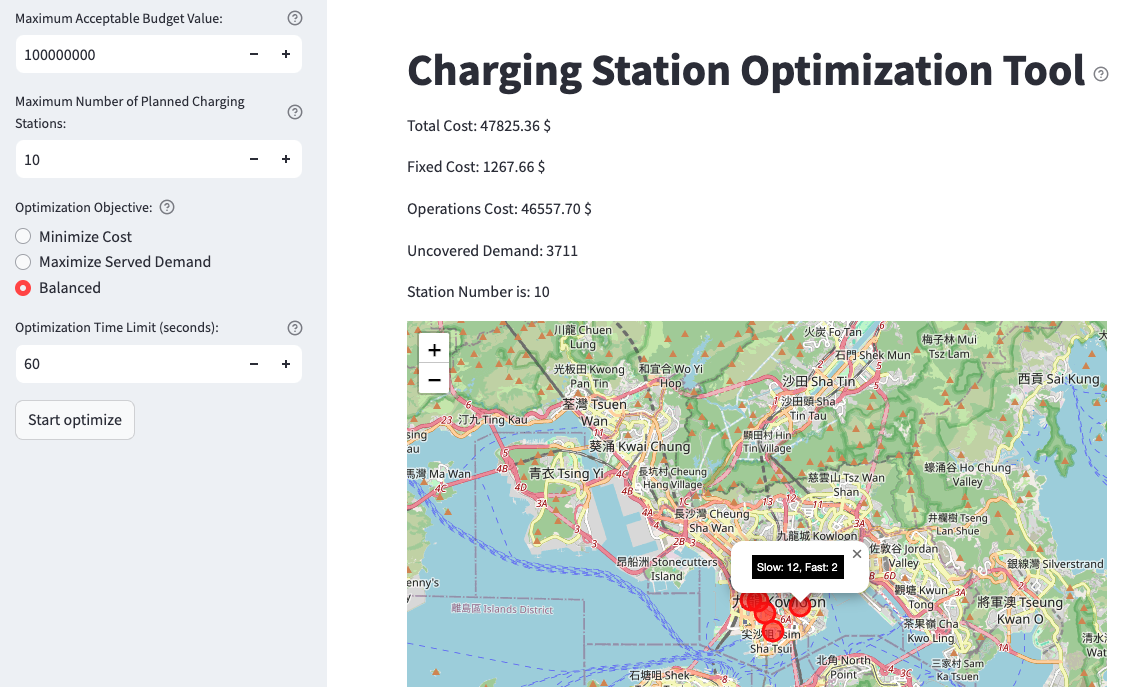
Charging Station Optimization Tool
This tool is specially designed for charging pile operators. It can calculate the optimal location, number, capacity and cost of charging piles based on real traffic data in Hong Kong. The tool also supports optimization based on user-defined budgets, optimized focus on electricity, layout size and other elements.
GO TO TOOLBOX ➤
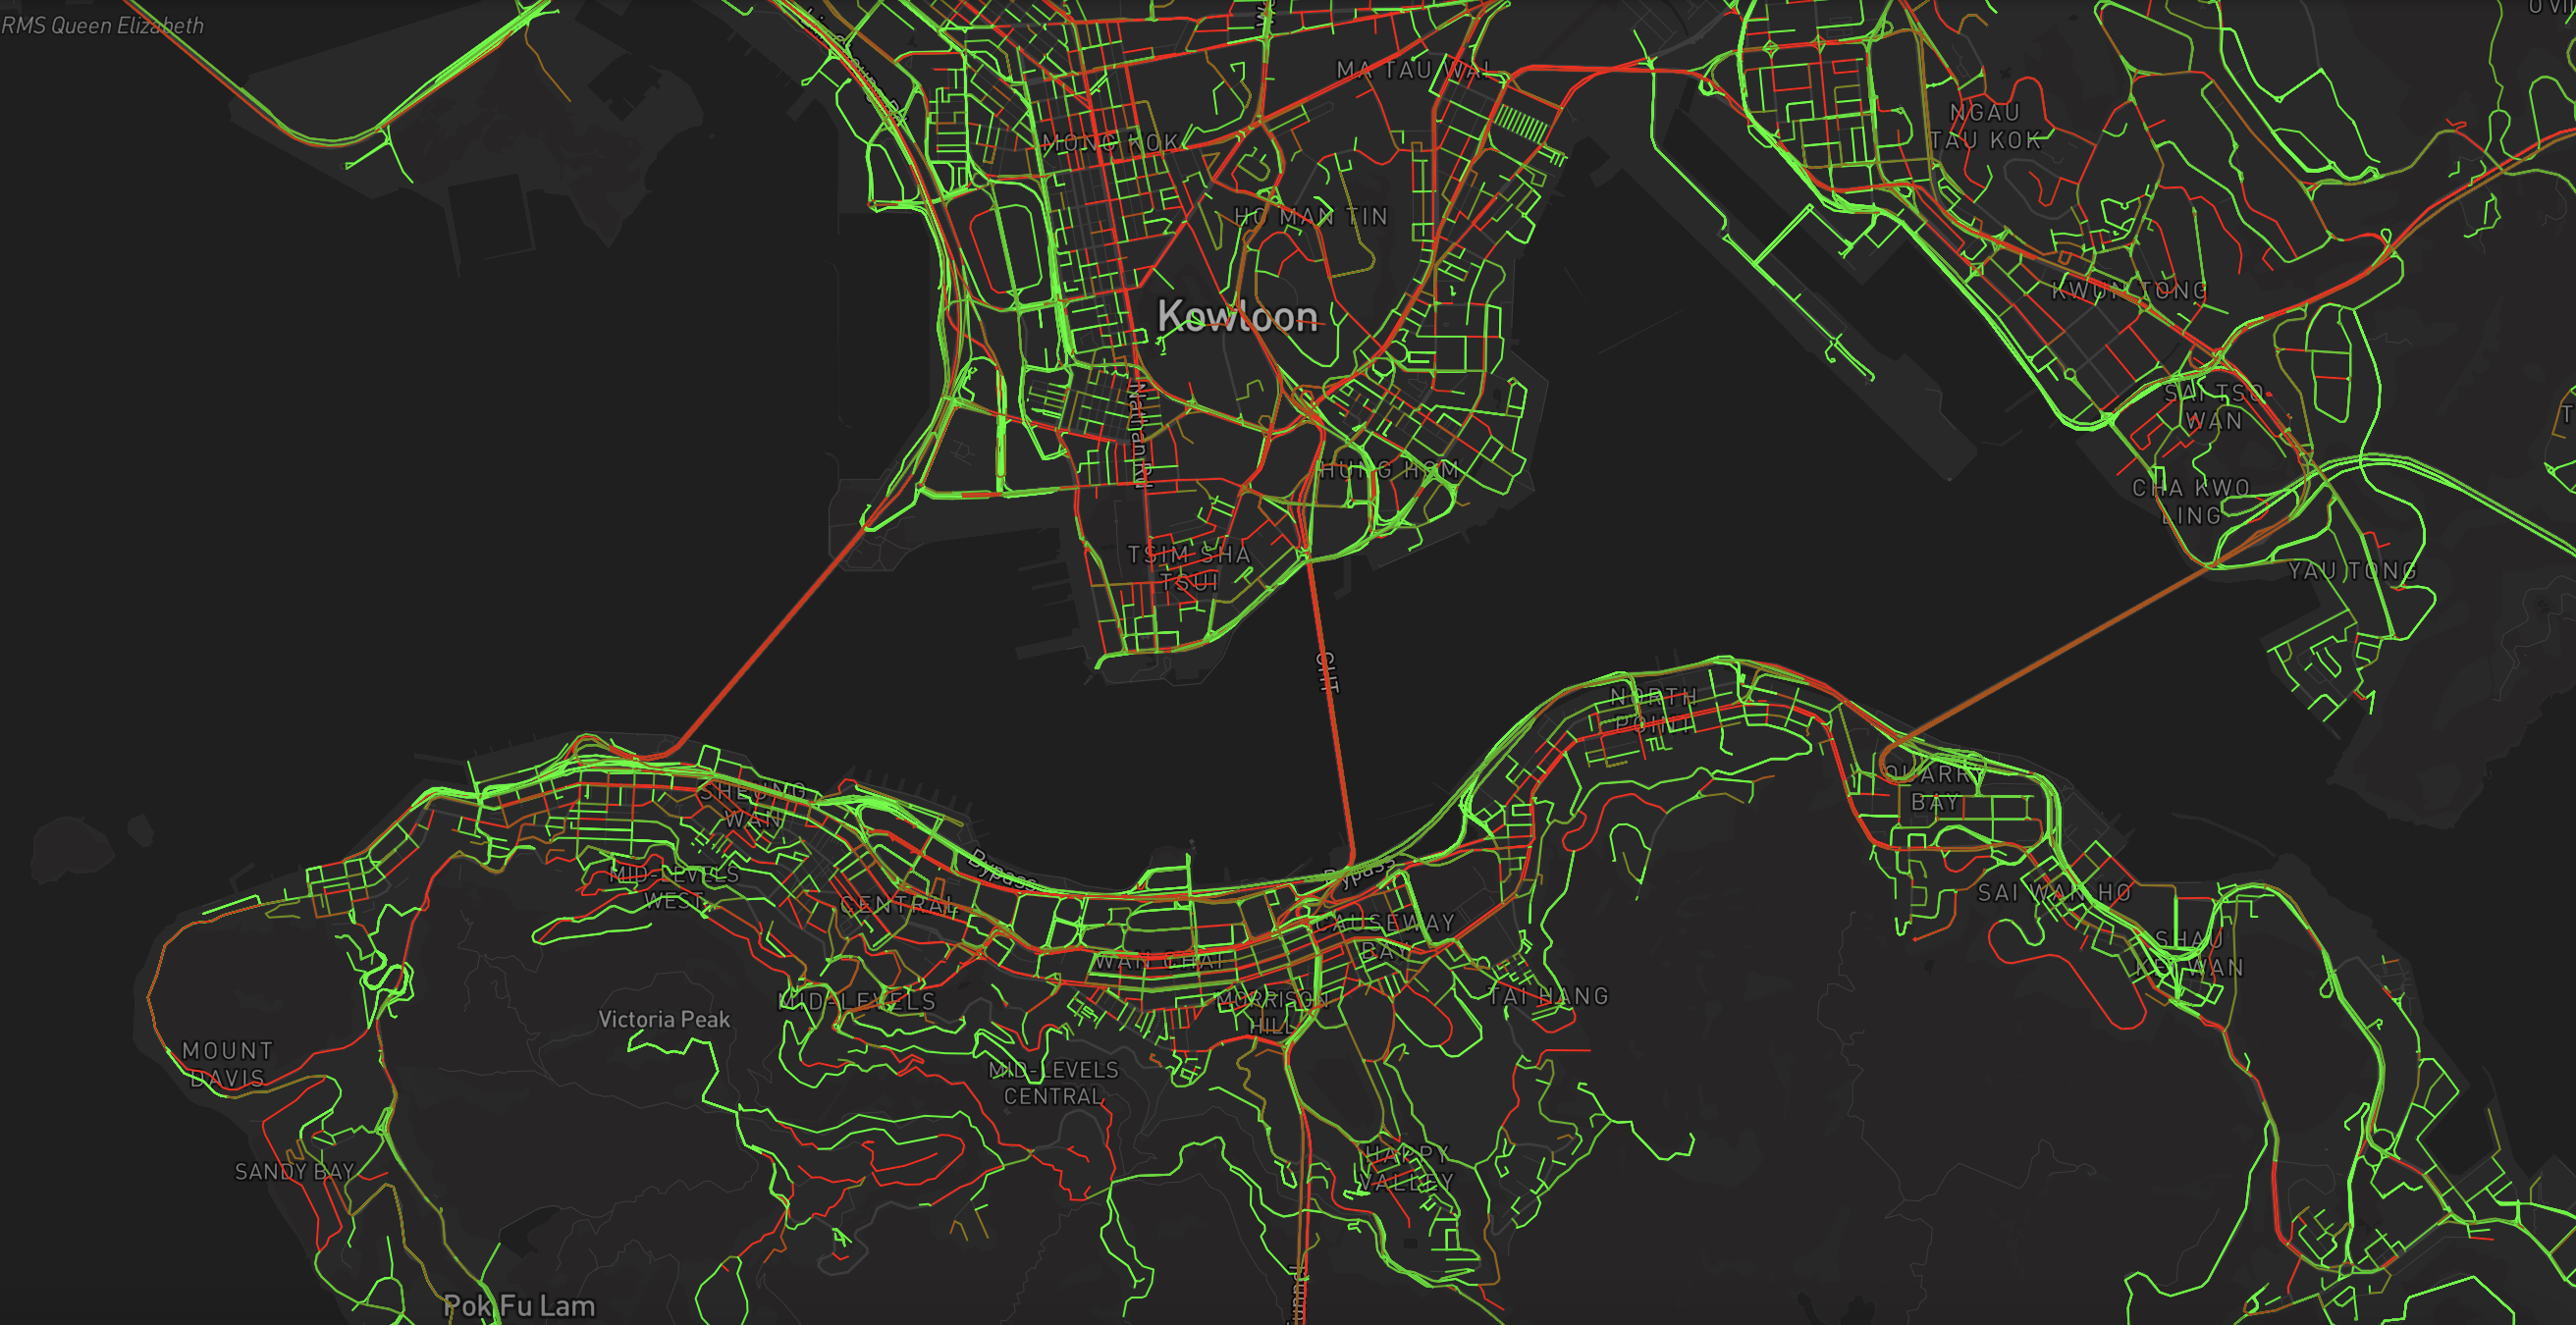
Traffic Flow Visualization
This demo features an interactive map that visualizes real-time traffic flow in Hong Kong. Using advanced geospatial technology and sensor data, it offers detailed insights into traffic patterns across the city. Users can view the overall traffic situation or zoom in on specific roads to see real-time vehicle counts. This tool is helpful for urban planning, traffic management, and policy-making, supporting data-driven decisions for sustainable city development with its user-friendly design and real-time data.
GO TO VISUALIZATION ➤